Thursday 22 November 2012

Tenaga Nasional Berhad (TNB) as a monopoly company in Malaysia


Tenaga Nasional Berhad is the only company in Malaysia which supplies electricity to households. The company remains as the only electricity supplier direct to consumer, because to start such a monopoly business as TNB will require a company to invest a huge amount of capital. A huge capital is needed mainly for the start-up of power plants with high electric capacity of megawatts.


Manjung Coal Power Plant

Why is it that TNB the only company that supplies electricity to household? Even if other companies where to start an electricity supplying company same as TNB, assuming they have more than enough capital. So why can’t they start the company? It would be because of legal barrier to entry of patents or/and licenses own by TNB. In this case it would be license that TNB have gotten from the government to operate the business. Thus, having just one company to supply electricity to consumers will help maintain a healthy market.

As an example, we now assume there are two companies supplying electricity in Malaysia TNB and Hew Electricity Berhad; having two companies to choose from for consumers, it is definite that consumers will most likely make a decision based on which company can offer a cheaper price. Furthermore, not just price will be the issue but number of power plants will also increase in the country, which will lead to the increase of transmission towers, what’s worse is how will they direct the cables to each household who chooses different suppliers. In order to resolve these issues, the government have given the license to only TNB to operate this business. This helps limit the entry into the industry by using license, and these is why monopoly industry have extreme barriers.

Nonetheless, a government directive is also part of barriers to entry a certain industry, but for monopoly the government have set it is as a consequence of imposition of regulation that makes entry of new firms unattractive or almost impossible.

In addition, TNB has ownership on the scarce raw materials and this plays a part in making an effective barrier to entry with no other firms having access to the scarce inputs to produce their output. So, if a certain production requires a particular input, and the single firm which owns the entire supply of the input, the firm will have complete control in the industry. In this case TNB have access to coal, which is the cheapest raw material used to generate electricity here in Malaysia. 


Moreover, a single firm should be in this industry to keep the production cost from increasing, if there were more than one firm in this industry it will contribute to a higher price in coal. Than the coal supplier will sell the coal at a higher price, because coal is a scarce resource by selling it at a higher price will contribute to the increase of production cost.

Monopoly Profit Maximization

Based on the graph where production at the Marginal Revenue (MR) = Marginal Cost (MC) output. In order for the company to obtain maximum profit, the price must be set at the point coloured blue, where it touches the demand curve and must be above the Average Total Cost (ATC). If TNB remains a monopoly in this industry it will be able to make supernormal profits indefinitely.


Recently in the 4th quarter TNB had made a RM 1bil profit, they had a better turnover compared to the previous year in the same quarter where they had made a loss of RM338.6mil. TNB’s revenue rose from RM9.15bil to RM9.33bil this year.

In relation, TNB was able to secure the coal at a cheaper price. However, TNB had also secured a bid on a new combined cycle gas turbine plant in Seberang Prai. The new power plant will increase TNB’s capacity to supply electricity to consumers; this will also lead to higher profits for TNB in the future. The profits increase due to the efficiency of the plant, it is able to produce an output of 60 per cent, being able to utilise the raw materials prices can be kept low.

Since TNB is a pure monopoly this makes the firm a price maker, so if prices were to be maintained or increase in the future, even with the new plant up to produce electricity by 2016 at a cheaper rate, TNB will still be making a higher supernormal profit during that period, which will boost the company’s income.

Resources:


Supply and Demand


   When PlayStation 3 was first released in Japan during 2006, the quantity demanded for the game console was crazy! It was said that soon after the PS3 system was released, almost 80,000 of them were sold within 24 hours. The demand for PS3 game console was so high that the customer who preordered it got huge disappointments due to the limited supply of consoles available. When the consumers are willing to purchase more than the producer able to supply, this resulted in shortages.
  
   To illustrate the example, the price for PS3 game console is constant and does not meet the market equilibrium, so it causes the quantity demanded (QD) for PS3 game console is more than the quantity supplied (QS).


PlayStation 3
Nintendo Wii
Although the price is already as high as thousand ringgits for each PS3, but people seems to be quite unresponsive towards the price. So, what causes the demand for PS3 to reach so high? Simply it is the trend for teenagers to own a PS3 these days. Compared to Nintendo Wii, although the price of Wii is cheaper, but the quality of PS3 is much better than Wii in terms of high definition of graphic, Blu-ray player and can be played via online. 

 
  My opinion would be the firm should increase the price of PS3 to reach the market equilibrium in order to get rid of shortage. When the price is increase, from P1 to P2, the quantity demanded for PS3 will decrease, the quantity supply will increase and meet at the market equilibrium, Q.


Wednesday 21 November 2012

Oligopoly

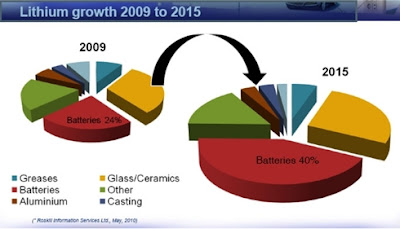
Recently, the demand and the price for lithium are increasing. The uses in lithium expend in vehicles, ceramics, electronics and lubricants. By the exploding popularity of iPads and the increasing sales of hybrid vehicles, they are few investors planning to invest in producers of lithium for batteries. Lithium’s use in technology has been increasing about 20% a year since 2000. There is high demand in lithium for the making of many electronics and car batteries. The market for tablet computers and hybrid electric vehicles is growing faster than expected. Apple’s iPad is widening and its lead as consumers’ top choice. Without lithium, the whole mobile technology or hybrid car technology would not have been possible.

(Diagram 1)

Aside from Talison Lithium Ltd (TLH), the trio of Rockwood Holdings (ROC), Sociedad Quimica y Minera de Chile (SQM) and FMC Corp. (FMC) control most of the world’s production in lithium. Besides, Rio Tinto Group (RIO), the third biggest mining company may enter the lithium business by opening a new mine in Serbia. Once the facility begins production, it says it will be capable to produce about 20% of the world’s output of the metal. However, Sociedad Quimica y Minera (SQM) is the only member of the oligopoly whose stock has been in the red for 2012.

            An oligopoly is a market when only a small number of large sellers competing with each other and sell a product or service. There are homogeneous or differentiated products. Products such as lithium can be homogeneous, a pure oligopoly. Prices in an oligopoly tend to remain stable because if one company increases the price too much, the others seem to do the same. The lithium producers have publicly stated that the pricing over the past two years have increased. In 2011, FMC Lithium announced three times that they would increase pricing in their lithium products. Additionally, FMC just announced the price will increase on 18th of June, 2012. (Diagram 2) Furthermore, Talison Lithium, the only pure-play lithium producer, announced in December of 2011 that it will increase the prices by 15% and expects to increase the prices again. A price increase has been agreed with the customers. Moreover, in oligopoly, it’s not easy for potential rivals to enter the industry. There are high entry barriers or natural entry barriers. Barriers to entry exist such as copyrights, patents, advertisements and also economics of scale (EOS). 

(Diagram 2)

          Last year, Argentina is promoting the idea of an OPEC-like cartel for lithium. Argentina, Bolivia and Chile, which total control 85% of world’s reserves of lithium, a key component in electric car batteries. In the near future and with the high level of production, Argentina, Bolivia and Chile may control the lithium market. A ton of lithium worth $2,500 in 2004 and now sells for around $6,000.

          In conclusion, lithium is going to be very important to the future world of hybrid electric vehicles because lithium’s use in batteries for electric vehicles. Other than hybrid electric vehicles, lithium is also used for many electronics such as smartphones, tablets and laptops. No doubt, the demand and the price for lithium will be continuing increasing in the future. 

(Diagram 3)


Elasticity of Demand


   There are many types of products with elastic demand and inelastic demand. For example, groceries, car and branded goods are all elastic products . However, there are also determinants that affect the elasticity of demand, such as the level of income and price of related goods. If the level of income decreases, people will tend to decrease their consumptions by putting their priority in necessities instead of luxuries or wants, changing their demand into inelastic. If the price of petrol increase, the demand for car will be more elastic. 


Let us discuss more specific about the two types of substitute products: Pepsi and Coca Cola. These products are also considered as luxuries because they are not the necessities of human. Luxuries-type products are mainly under elastic demand. For Pepsi and Coca Cola, not only that the consumers compare the taste, the product’s packaging and the promotion from these two rivals, but also, the price of these products. They had been competing to get the best price to offer to the market for ages! Of course, the consumers will always choose the cheaper brand.


To illustrate, when the price of Coca Cola decrease and is lower than Pepsi, consumers will buy Coca Cola instead of Pepsi.

Elastic Demand


On the other hand, products with inelastic demand are the one that we need in our daily life. For instance, the necessities that we need are electricity, water and petrol; for heavy smokers, cigarettes is a must in their life. Without these, our daily life will be affected, that is why we purchase them even if the price of products increased and same goes to heavy smokers. Changes in price will not affect the quantity demanded too much.

For example, one of the important energy sources would be petrol which is used to run the engine in our transport. A few months ago, the price of petrol increased, yet people unable to cut down the usage of petrol as it will affect the transportation to work and it will lead inconvenience. So, inelastic demand can shown by the diagram below. Although the price of petrol increase, the quantity demanded decrease in a small portion.

Inelastic Demand


In conclusion, elasticity is used to measure the responsiveness from the consumer towards the changes in economic variables, such as price and level of income, plus the other determinants such as the substitutes available in the market and luxuries vs. necessity. 

Sources:
<http://www.tutor2u.net/economics/content/topics/elasticity/elastic.htm>
<http://www.aamcompany.com/a-refreshing-new-strategy-in-the-beverage-industry/>
<http://www.forbes.com/sites/tomkonrad/2012/01/26/the-end-of-elastic-oil/>

Monday 19 November 2012

Fiscal Policy

The Malaysian Government remains flourishing the nation’s economic growth despite the challenges and uncertainties in the global economy. Malaysian economy is predicted to increase between 4.5% and 5.5% based on the prospects of a better global economy in 2013. Based on Budget 2013 of Malaysia, the Government prudently managing the economy by increasing the Gross Domestic Product (GDP) and this is where the fiscal policy steps in.


Fiscal policy can be defined as the changes in government spending and tax collections to achieve non-inflationary domestic output and full-employment. How does fiscal policy affected the GDP? According to the Budget 2013, prepared by our Prime Minister, the government is proposing that the annual income tax of an individual to be reduced by 1 percentage point for each grouped exceeding RM2,500 to RM50,000. Next, knowing that cost of higher education is a financial burden to the parents, the government proposes that the current tax relief of RM4,000 to be increased to RM6,000 per person. Government is trying to reduce the tax in order to encourage the consumers to consume more, hence increasing the consumption. Plus, a reduction in tax also shifts the aggregate demand curve to the right.

   The government is allocating a total expenditure of RM251.6 billion to Operating Expenditure and Development Expenditures, RM201.9 billion and RM49.7 billion respectively. Both expenditures are for the implementation of the country’s development projects, with focus on the well-being of citizen. Compare to Budget 2012, the expenditures have increased by RM18.8 billion. Clearly, the government planned to increase their expenditures to cause the unemployment to fall and the employed workers will have income to spend, resulting in aggregate demand to increase. Thus, the aggregate demand curve shifts rightwards.

   The fiscal policy that the government is applying is the Expansionary Fiscal Policy, where the government combines expenditures increasing and reduction of taxes to produce the desired initial increase in consumption and eventual rises in aggregate demand, from AD1 to AD2. (Diagram 1) 


   The shifting of AD curve results in raising the GDP and tax revenues automatically rises. When the tax revenue rises, the budget deficit moves slightly to the right, which means that the amount of government’s revenue will eventually exceed its expenditures. (Diagram 2)

Resources:
1. Tax Revision on Individual Income and Cooperatives
 <http://www.bnm.gov.my/files/2012/bs13.pdf#page=4>
2. 2013 Budget Allocation
<http://www.bnm.gov.my/files/2012/bs13.pdf#page=4.>